


The US dollar has been bearish since creating a swing high back in Jan 13th, 2025. This bearish order flow has not changed since then. This past week continued its bearish order flow indicating potentially we may continue lower in the coming weeks.
This weekly forex forecast includes how I’m viewing the DXY, EURUSD, and GBPUSD this week.
US Dollar Index (DXY) Forecast
DXY Weekly Chart
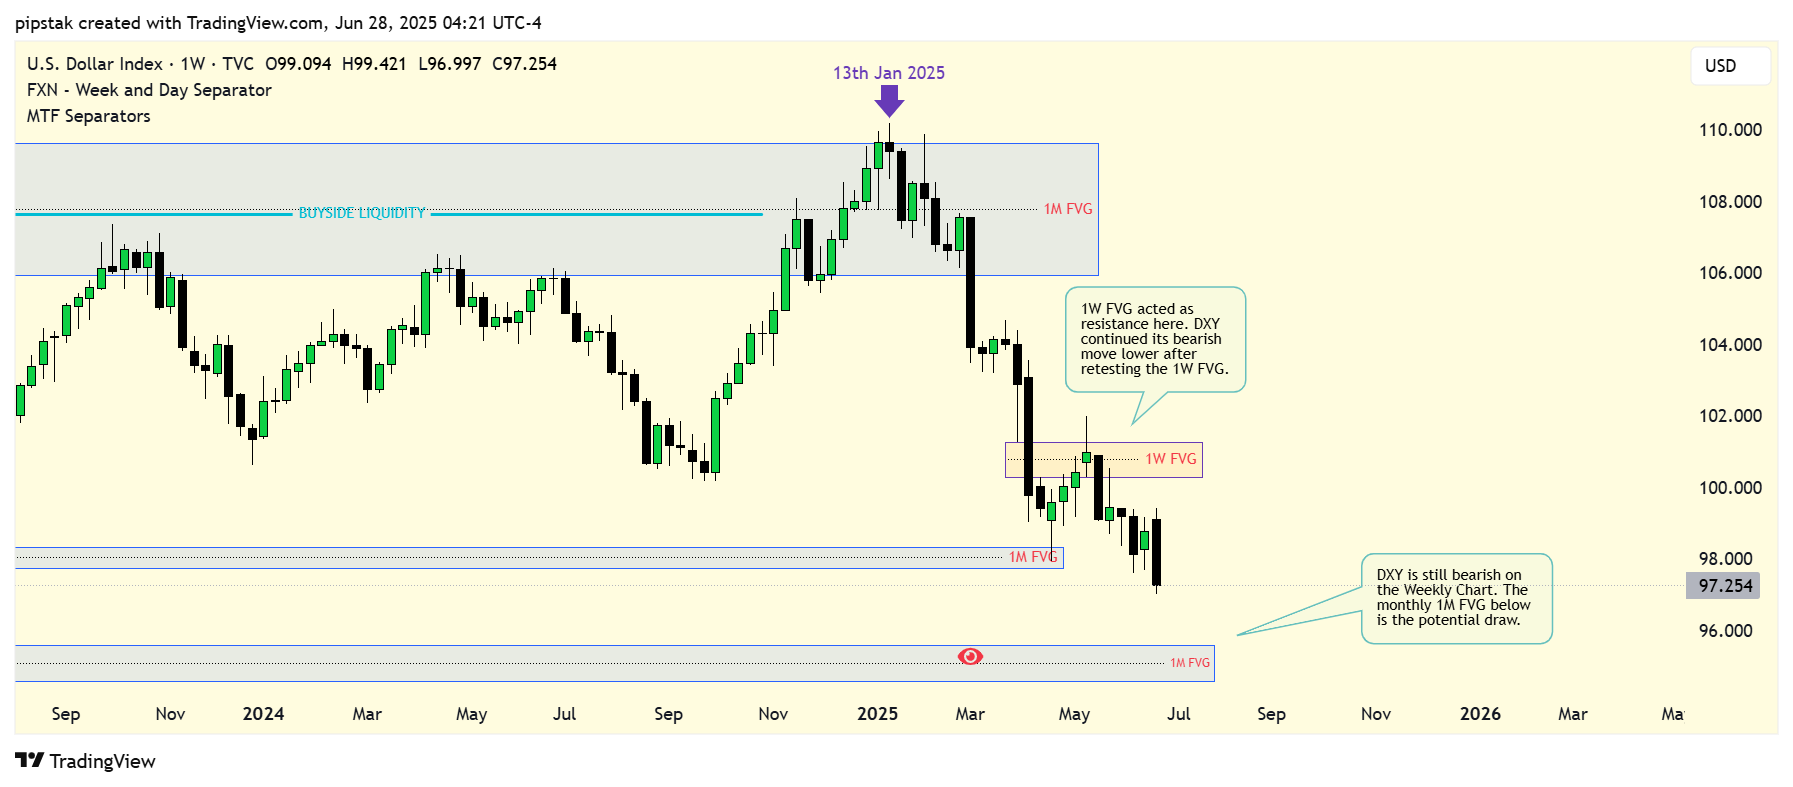
The DXY maintained its bearish order flow this past week, after we came off 1W Fair Value Gap back in 12th May, 2025. We are still bearish on the Dollar Index as long as we keep getting lower lows on the weekly chart.
From last week’s weekly forecast, the market continued lower as anticipated.
DXY is still bearish on the Weekly Chart. The monthly 1M fair value gap below @ 95.570 is the potential draw.
DXY Daily Chart
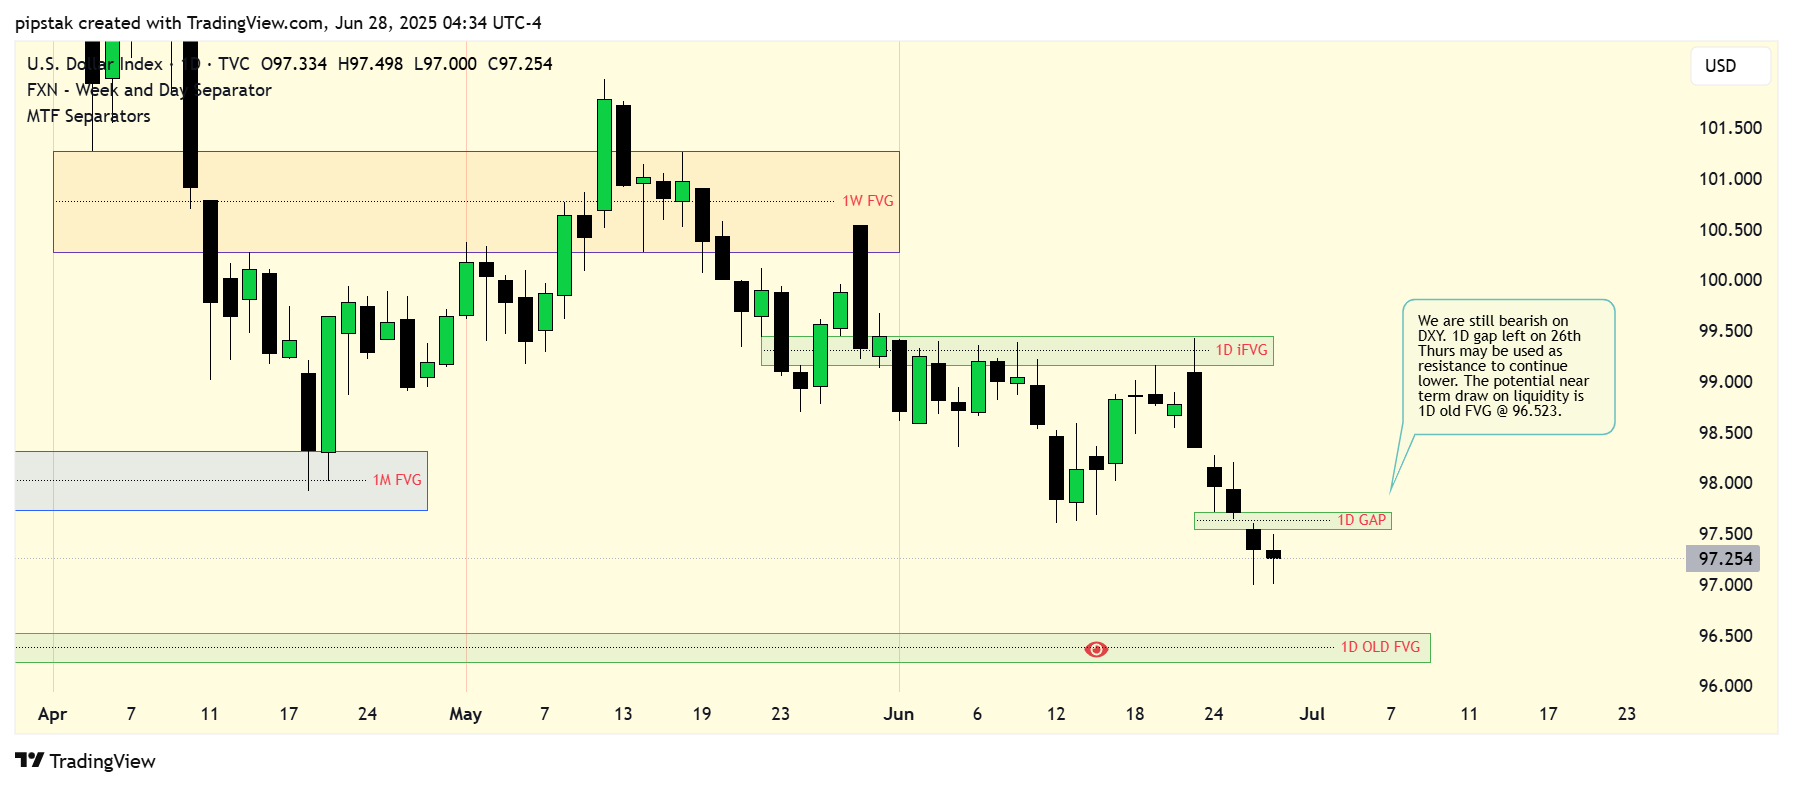
The Dollar Index has been bearish throughout this past week. We continued with the bearish order flow confirming that the underlying trend is still holding.
Want to Learn How to Trade?
Tired of going back and forth in trading? Are you tired of watching countless YouTube videos that gets you more confused than you were? Just get this course… you’ll be happy you did!
We are still bearish on DXY. 1D gap left on 26th Thurs may be used as resistance to continue lower.
The potential near term draw on liquidity is 1D Old FVG @ 96.523.
EURUSD Forecast
EURUSD Weekly Chart
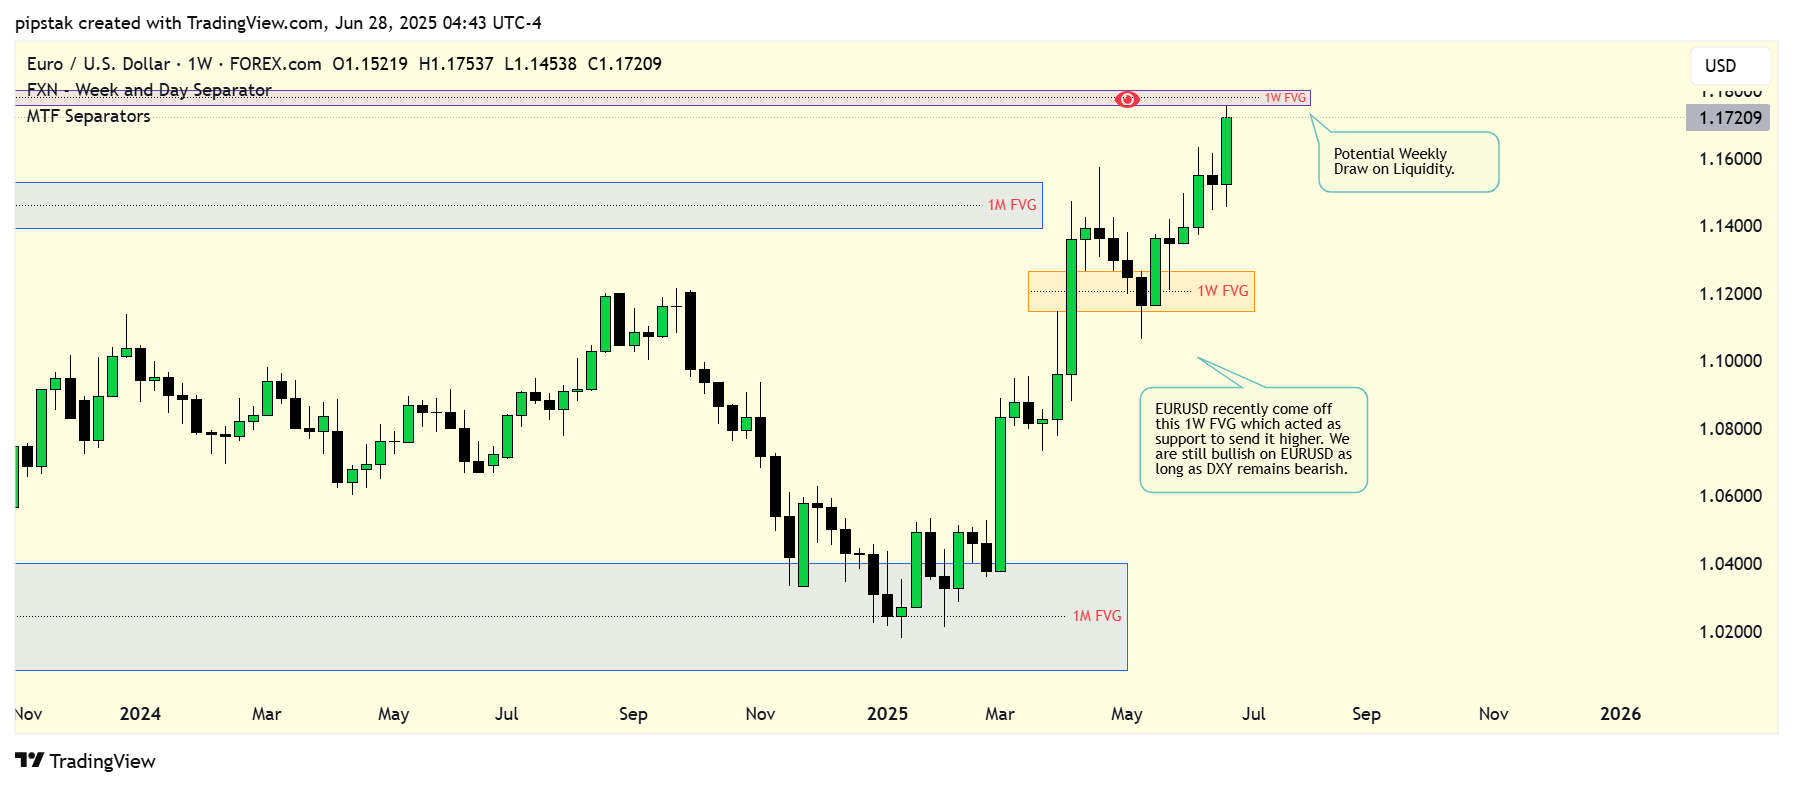
The EURUSD has been bullish since the beginning of the year. The bullish order flow has NOT changed.
EURUSD recently came off a weekly fair value gap that provided support to continue the bullish order flow. We are still bullish on the EURUSD as long as DXY remains bearish.
The potential draw on liquidity when EURUSD bullishness continues is an old weekly FVG as outlined below @ 1.17556.
EURUSD Daily Chart
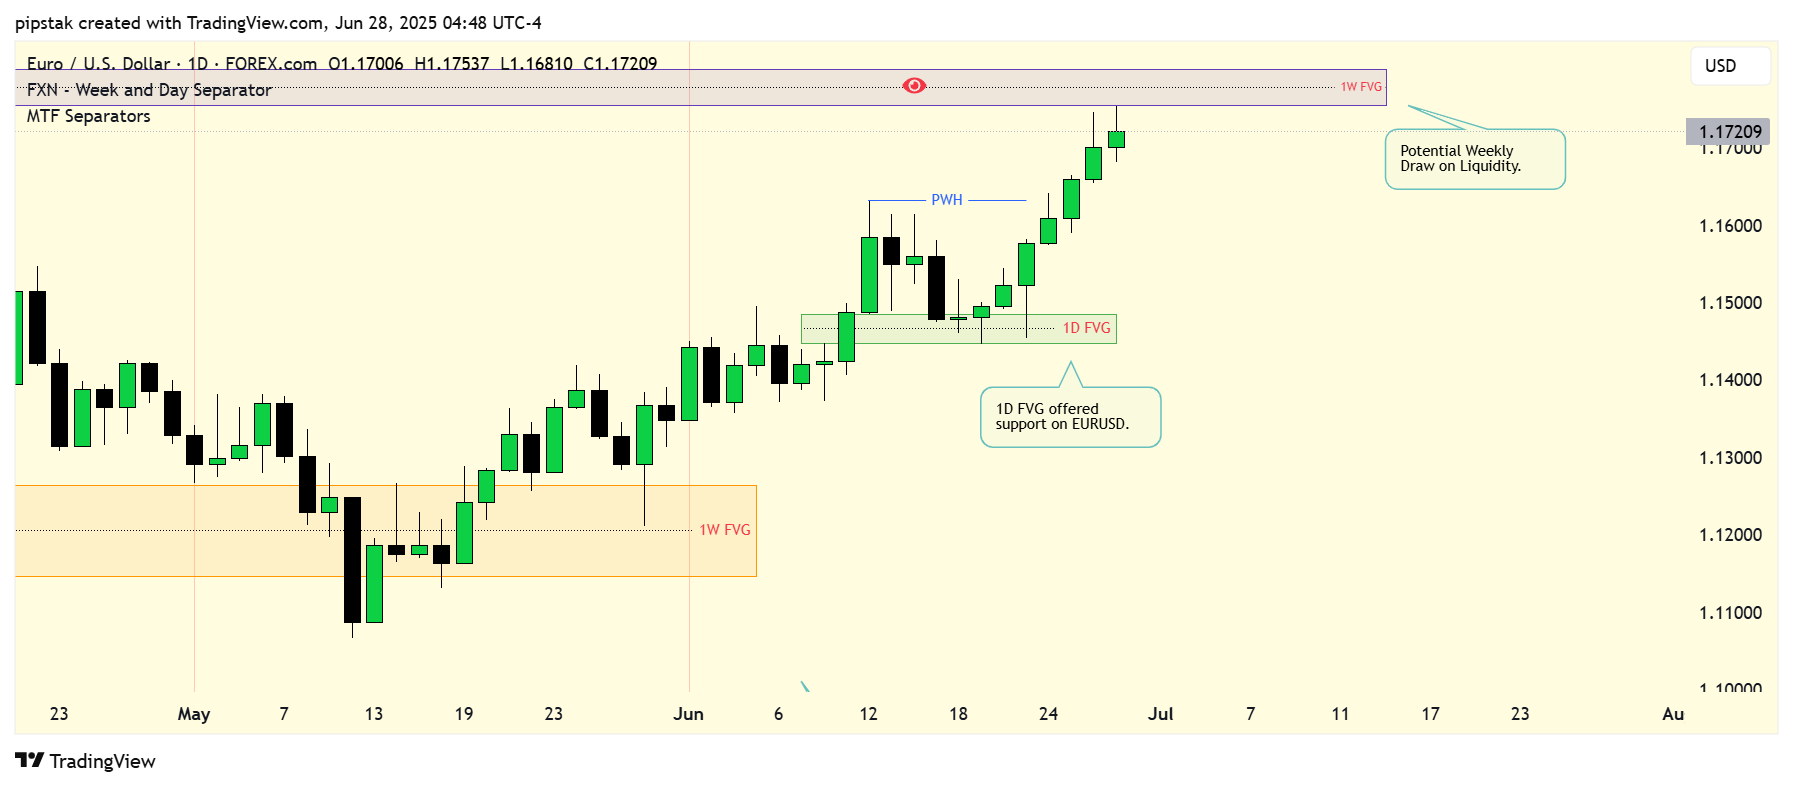
The EURUSD has been bullish throughout this week as anticipated. I anticipate further bullishness on the EURUSD daily chart as long as DXY offers bearishness.
The potential near term draw on liquidity is previous 1W FVG @ 1.17556
GBPUSD Forecast
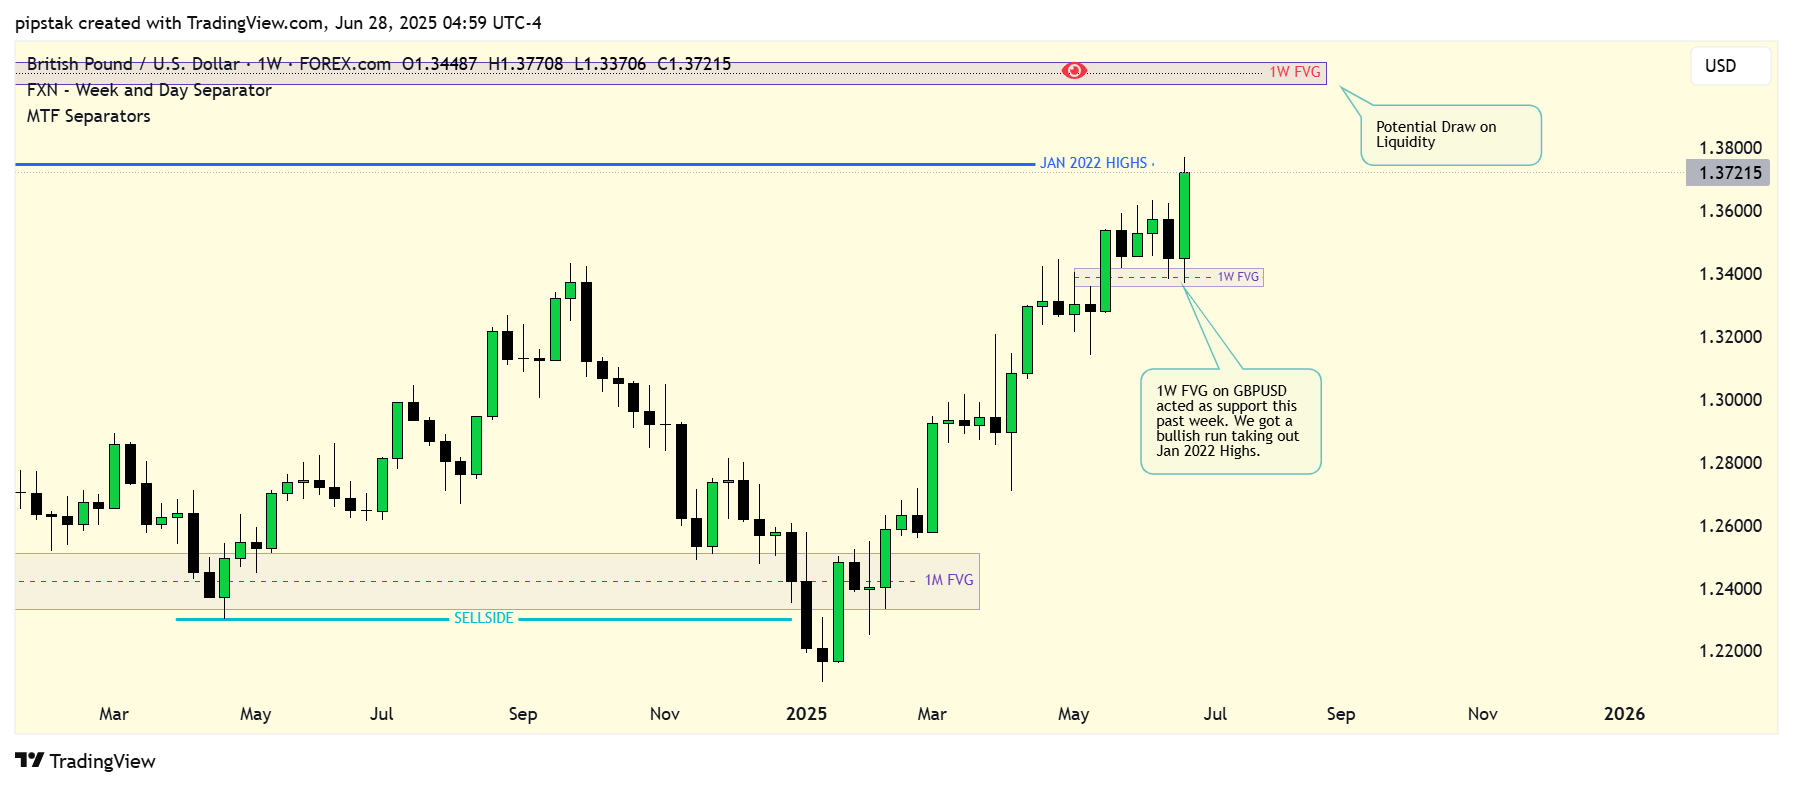
GBPUSD Weekly Chart
1W FVG on GBPUSD acted as support this past week. We got a bullish run taking out Jan 2022 Highs. The bullish order flow established back in January still holds as long as DXY remains bearish.
The potential weekly draw on liquidity is old 1W FVG @ 1.40014
GBPUSD Daily Chart
The GBPUSD remains bullish. We came off the weekly FVG on Thursday, 19th June in the previous weeks. I remain bullish as long as DXY remains bearish.
The GBPUSD has broken structure this past week on Wednesday, 25th in the daily chart. This daily BMS is very significant! I would prefer to see the 1D BMS hold on a daily closing basis for continued bullishness.
The potential near term draw on liquidity is previous monthly highs [Oct 2021 Highs] @ 1.38347 on the upside.

Top Partner Props & Brokers